Three events, and a measurement that changed underneath them
Cities in Motion Index 2026, Berrone and Ricart, 183 cities. The 2026 edition is the first to score a spread of this kind explicitly.
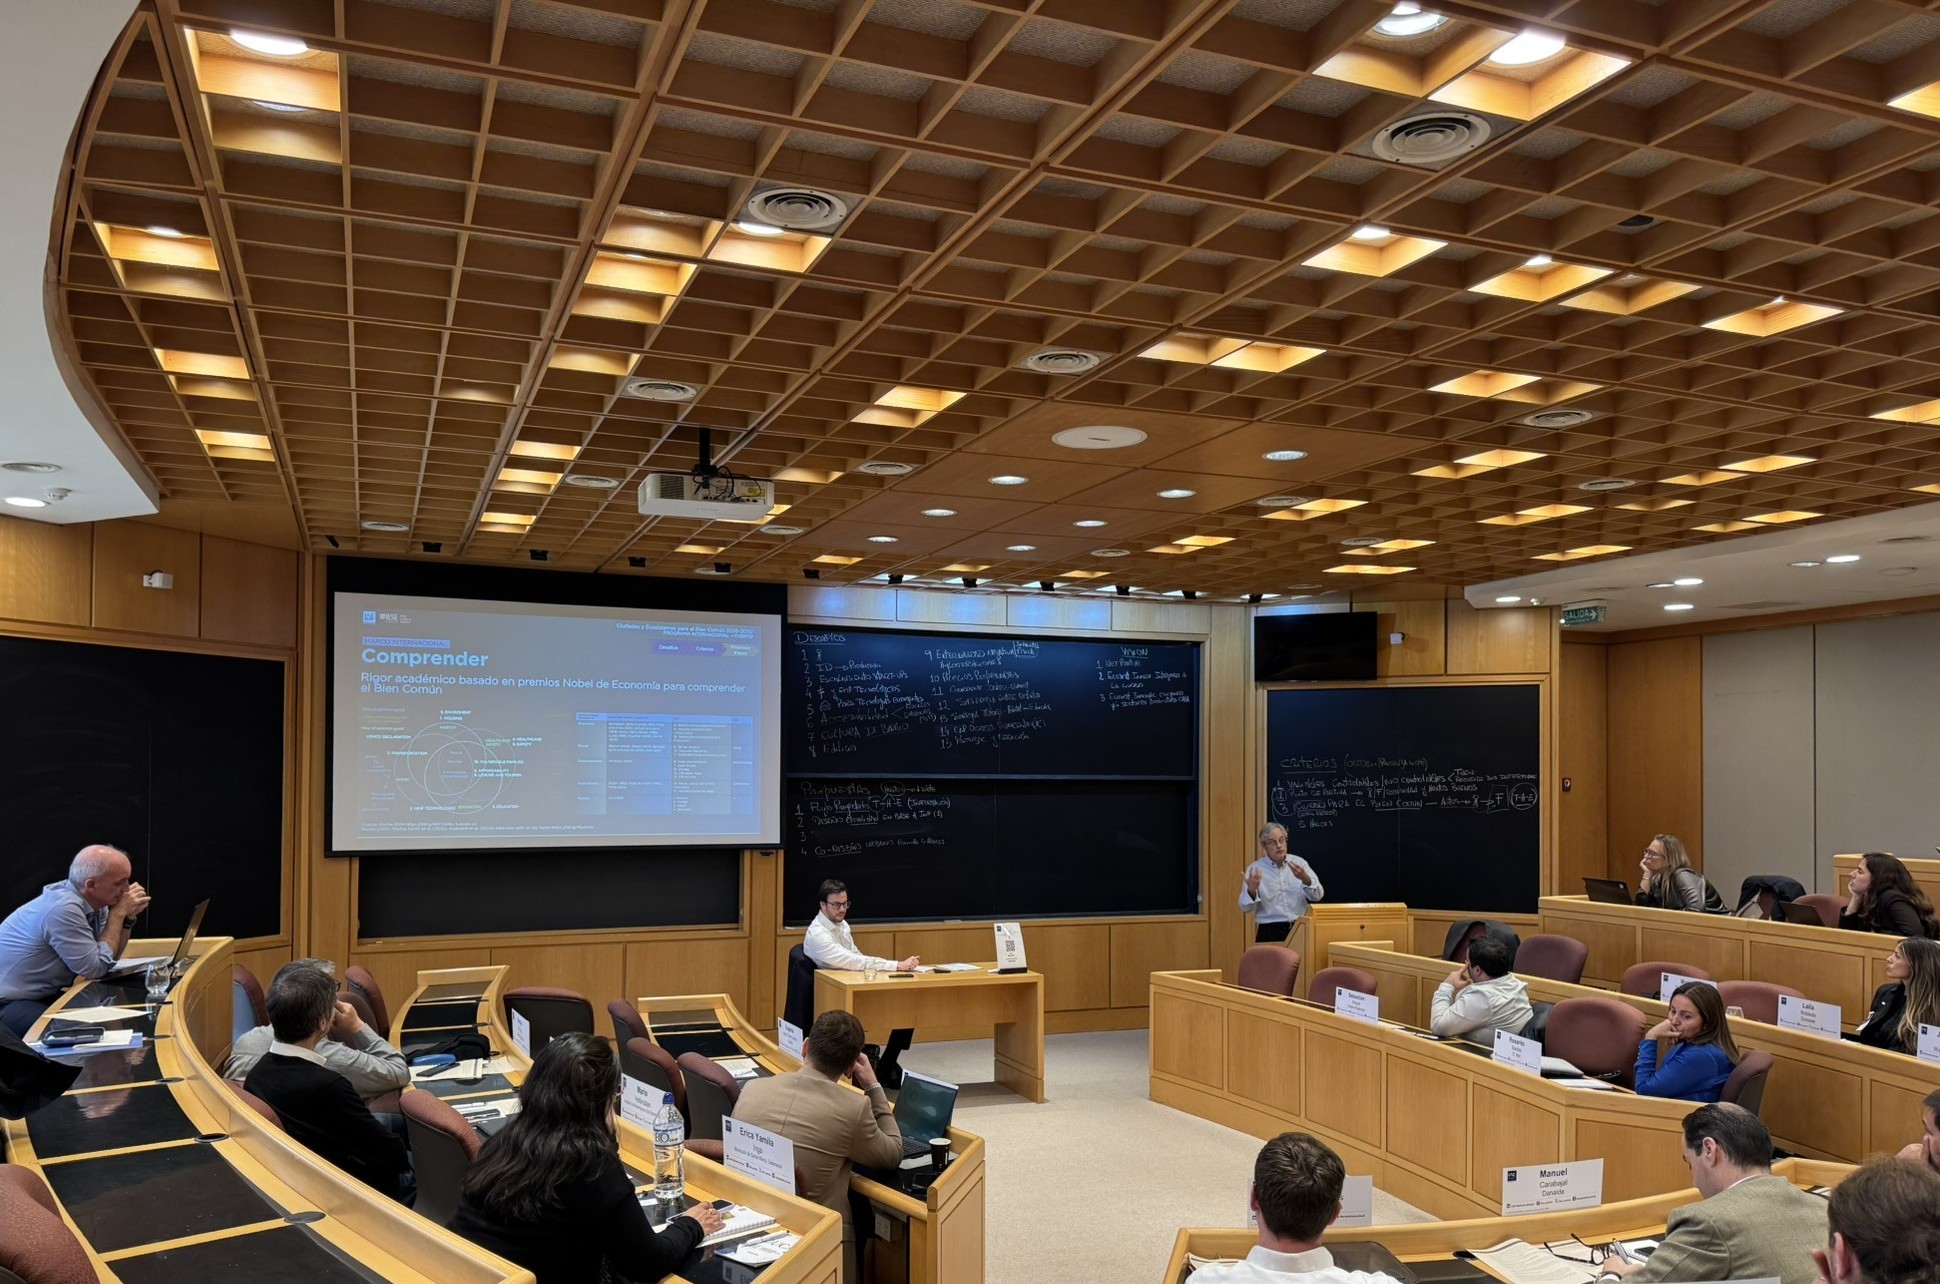
On 28 and 29 September 2026, the fifth edition of the IAE–IESE Cities in Motion International Programme met at Pilar and launched an agenda it called Cities and Ecosystems for the Common Good 2026–2030, with a Letter of Adhesion signed by founding local governments, institutions and firms. In the Competitive Districts and Integrated Cities track, Buenos Aires was presented as a live case by the City's Undersecretary of Investment, alongside Héctor Rocha of IAE, Pascual Berrone of IESE, CAF and the 22@ Network Barcelona. Rocha's framing of the week was the operative one: innovation is also managed.
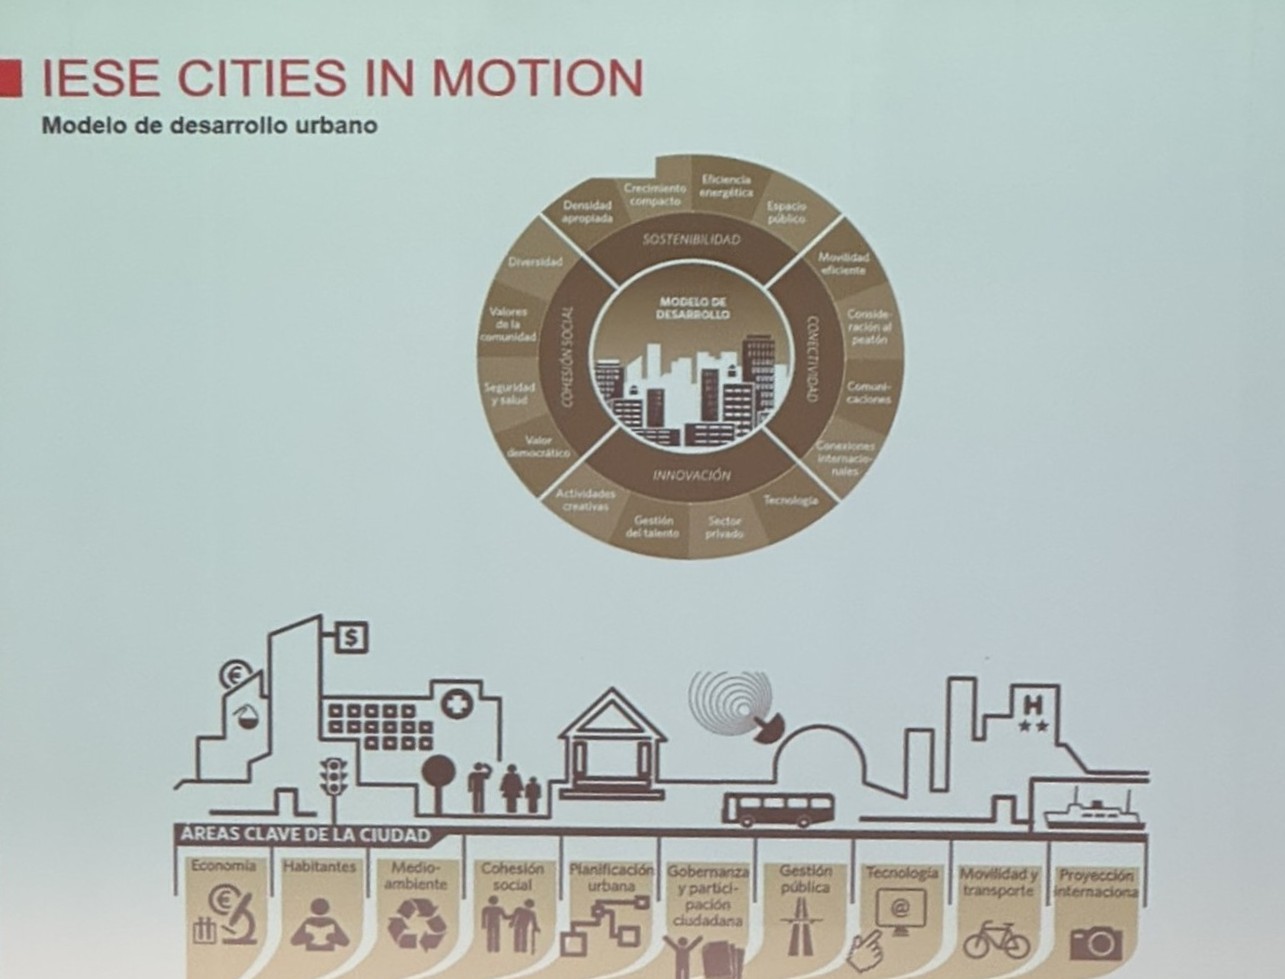
The second event is a methodology change, and the one that should worry a district portfolio. IESE's Cities in Motion Index 2026, its eleventh edition, ranks 183 cities in 92 countries on 115 indicators across nine dimensions. This year it adds a Sustained Competitiveness Index weighting three things equally: global rank, the change in that rank over 2023–2025, and the dispersion of a city's ranks across the nine dimensions. The report's reading is blunt — specialising in a single dimension can work short term and creates long-term structural vulnerability, and New York, second overall, ranks twelve places lower on the new indicator because of its dispersion. Consistency is now scored. Peaks are discounted.
Buenos Aires is 104th overall with a score of 44.87. The dimensional profile is the thing to read: 17th on technology, 28th on governance and on urban planning, 39th on human capital, 44th on international profile — and then 159th on mobility and 179th on economy. A spread of 162 places between best and worst dimension is precisely what the new sub-index penalises.
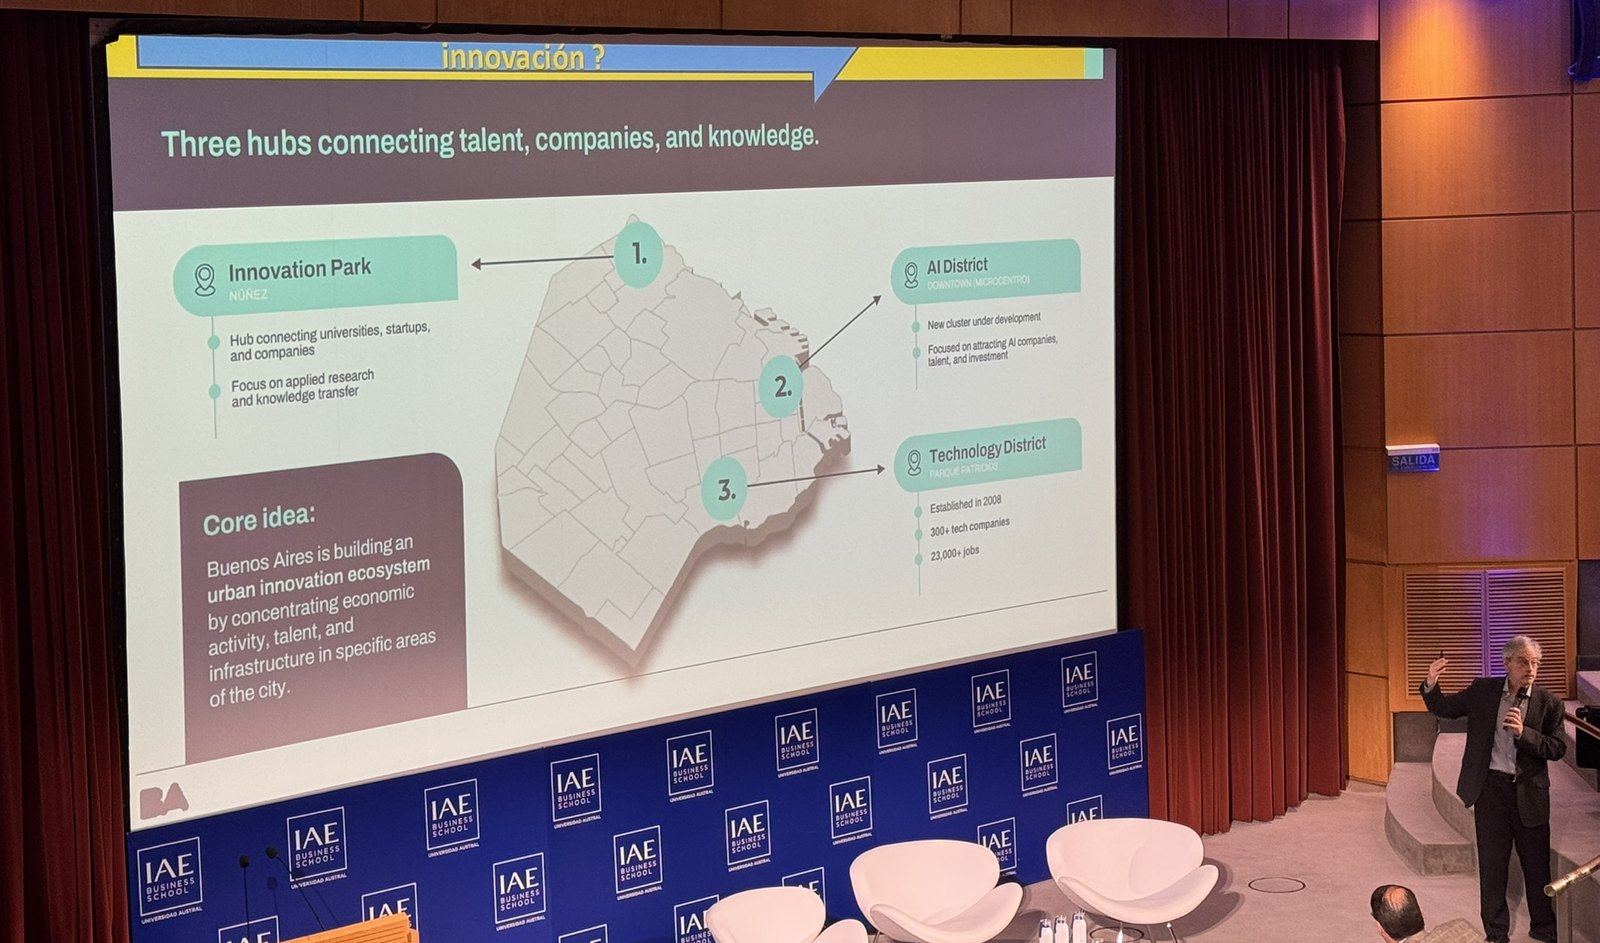
The third event is the portfolio itself. In March 2026 the City sent the Legislature a bill creating an Artificial Intelligence District in the microcentro, carrying exemptions on gross receipts, stamp duty and property tax, Banco Ciudad credit at 8.5% financing up to 75% of property value over 20 years, and a regulatory sandbox. It is the third instrument in a line running from the Technology District created by Law 2,972 in 2008 in Parque Patricios, through the Innovation Park on 12 hectares of the former Tiro Federal in Núñez, where UBA, UTN, ITBA and Di Tella hold plots and an ente público no estatal administers the site.
Three instruments, eighteen years, one unresolved question: which of those numbers is net. The What Works Centre for Local Economic Growth review of enterprise zones, May 2025, found only half of studies reporting positive business outcomes, with earlier UK work finding between 50% and 80% of businesses in a zone had relocated into it. The US Treasury Office of Tax Analysis, in a June 2026 working paper, found Opportunity Zone employment up 1.3% against comparable undesignated tracts — but fewer than one in eight new jobs going to zone residents, and roughly 83% of the gross gain offset by losses in neighbouring low-income tracts. StartupBlink's Global Startup Ecosystem Index 2026 meanwhile places Buenos Aires 86th globally, down nine positions, fifth in Latin America, growing 1.1% — the slowest of the region's top ten.
A district can be world class at technology and bottom-decile at economy at the same time. That is not a paradox. It is an attribution failure with a street address.
The district decision loop
An innovation district is usually described as a place and financed as an incentive. Operationally it is neither: it is a sequence of recurring decisions about scarce public resources, and it either has an instrumented loop or a narrative. The useful spine is the technology readiness scale NASA introduced to stop an experiment being mistaken for a system that flies. Universities are strong at levels one to three. Markets arrive at eight and nine. As Camila Velasco set out in Perfil on 1 September 2026, a park exists to work levels four to seven — validation, prototype, first unit, first contract. That band is the valley of death, and the only thing a district can compress. Socradata therefore governs a district on three layers rather than one announcement.
Who receives the scarce unit, and on what recorded basis. The scarce unit is rarely the desk; it is the laboratory metre, the lab hour, the sandbox slot and the exemption year. The Innovation Park already runs this properly in form: an applicant submits a deck, a team, a product state, a scientific link and a space requirement, and a committee evaluates. Station F has selected this way since 2017, Hsinchu since 1980. The question is whether the score, the reason and the resource granted reach a record readable against an outcome three years later.
Movement through the four-to-seven band, measured per cohort rather than per press release. A tenant that enters at level four and leaves at level four has consumed laboratory metres and produced an occupancy statistic. The transition rate — the share of a cohort advancing two readiness levels in a defined window, with the first external contract confirming level seven — is what distinguishes a district from a subsidised business park. It also tells the city which vertical its laboratory capacity serves, as against the one the strategy document names.
Net outcome per unit of public resource, with displacement subtracted. This is where almost every district programme in the region stops. A firm that moved eight blocks to claim an exemption is a gross job and a net zero, and the Treasury finding above is why the distinction cannot be left to goodwill. Attribution requires a counterfactual declared before the cohort is admitted: comparable firms outside the perimeter, named at the outset, measured on the same clock.
Admission is usually governed, movement is rarely measured, and attribution is almost never instrumented — which is why the third box is dashed.
So what: a district without an attribution layer cannot be renewed on evidence, only on momentum. And a programme renewed on momentum eventually meets a treasury that has learned to read net numbers.
Two numbers span the framework, and neither requires new software. The first is net employment per peso of revenue forgone: perimeter jobs, minus jobs lost in a declared comparison ring, over the tax expenditure attributable to the district in the same period. The second is the TRL transition rate per admitted cohort. KPIs before APIs is the whole argument here — three districts have been built without the first of these ever being published.
Three loops already running in Buenos Aires
The three patterns below sit inside instruments that exist today in CABA. Each names the system of record, the decision loop, the override path and the outcome measure. Public figures are attributed; improvement ranges are labelled illustrative.
Innovation Park, Núñez — admission scoring with a laboratory constraint. Systems: the admission-committee workflow and the tenancy register held by the ente público no estatal, against the +54Lab booking schedule. Decision loop: an applicant's deck, team, product state, scientific link and space requirement are scored, and laboratory metres and lab hours allocated across the declared verticals of biotechnology, agriculture, health, artificial intelligence and aerospace. The resource is real: 360,000 buildable square metres with 120,000 reserved for innovation. Human override: the committee chair may admit below threshold for a named strategic vertical, recorded with a reason code and escalated to the mixed assembly. What is missing is not the committee but one field: an entry readiness level written at admission. Illustrative target: two-readiness-level advance for 30–40% of each cohort within 24 months.
Technology District and AI District — the exemption renewal nobody has to justify. Systems: the City revenue administration's exemption register against the Law 2,972 beneficiary list, and the municipal cadastre and permits record. Decision loop: an annual compliance certification continues or lapses an exemption on gross receipts, stamp duty and property tax. Today that loop turns on presence and paperwork. The 312 firms and 23,000 jobs the City attributes to Parque Patricios, Boedo and Nueva Pompeya are a gross count with no published comparison ring. Human override: a transition waiver with a dated expiry and a named approver, rather than silent continuation. The change is one field and one join. Interoperability or it doesn't scale is literal here — three registers that cannot be joined cannot produce a net number for any of them.
Microcentro conversion — underwriting a district against a vacancy series. Systems: the Banco Ciudad credit-origination workflow, the City's permits and cadastre record, and the office-market vacancy series. Decision loop: a conversion loan at 8.5% covering up to 75% of property value over 20 years is approved against a projected use and occupancy inside the AI District perimeter. The underwriting assumption is the district's actual risk, and the series is moving: premium office vacancy rose from 13.97% to 14.95% in the third quarter of 2026 even as net absorption stayed positive at 11,180 square metres, with the microcentro at 43.3% closed commercial premises. Human override: a credit committee re-underwrite triggered when the vacancy series moves outside a declared band, logged rather than assumed. Illustrative target: occupancy variance against underwriting within 10% at 18 months, per building rather than per programme.
None of the three requires a new platform, a new vendor or a new district. Each takes a decision already being made, names the system where it is recorded, gives it an owner outside the communications function, and attaches a number that reveals when the instrument stopped working. That is the line between a production control and POC theater, and it holds for public instruments as for enterprise agents.
Instrument the loop before the fourth district
Three actions, in order. The first costs weeks, not budget: build a single district register at firm level across the three instruments — firm identifier, district, entry date, entry readiness level, exemption type and value, resource allocated, employment by period, exit reason. The City holds every field; they sit in registers that do not join. Second, declare the comparison ring before the AI District admits its first cohort: comparable firms outside the perimeter, named at designation, measured on the same clock. A counterfactual declared afterwards is not a counterfactual. Third, publish a district tax-expenditure statement — revenue forgone per year, against net employment and the transition rate.
State the boundary as plainly as the finding. The international evidence establishes that displacement is large and routine in place-based incentive programmes; it does not establish a magnitude for Buenos Aires, and a UK enterprise zone is not a CABA technology district. The falsifier is cheap: build the register, declare the ring, and if after two cohorts net employment per peso forgone sits close to the gross figure, the displacement critique is wrong here. From pilot to policy means running that test deliberately rather than discovering the answer in a fiscal review.
So what: the City does not need a fourth district to raise its economy rank from 179th. It needs the three it has to produce a net number a treasury, an investor and a legislature can all read.
Governance
One control: a sunset-and-evaluation clause on every district regime, owned by the Undersecretariat of Investment with the revenue administration as data custodian. The OECD's Practical Guide to Investment Tax Incentives, April 2026, is explicit that a sunset clause not bound to an evaluation requirement is hollow, and that credible cost-benefit analysis must account for redundancy, displacement and opportunity cost. So the clause has two teeth: the regime expires on a stated date unless renewed by legislative act, and the renewal file must contain the net figure and the comparison ring, not an occupancy report. Neglect then fails closed.
KPIs
Net employment per peso of revenue forgone: perimeter jobs minus comparison-ring losses, over attributable tax expenditure; unmeasurable today because no ring is declared; baseline within two quarters of the register going live. TRL transition rate: share of a cohort advancing two readiness levels in 24 months; illustrative target 30–40%. Graduation and retention at 36 months: tenants that leave having scaled, against tenants that leave the city. Revenue forgone per net job: the figure a legislature will eventually ask for. Dimensional dispersion: the spread of the City's nine index ranks, currently 162 places.
Four-quarter roadmap
Q4 2026 — join the registers. One firm-level district register across the three instruments, with entry readiness level added at admission. A district without a firm-level record is a perimeter, not a programme. Q1 2027 — declare the ring. Name the comparison firms before the AI District's first cohort, and publish the first district tax-expenditure statement even if the net figure is uncomfortable. Q2 2027 — measure movement. First transition-rate report per cohort and per vertical, which will say more about where laboratory capacity should go than any strategy document. Q3 2027 — renew on evidence. Take net employment per peso forgone into the first sunset review, and put dispersion on the City's scorecard beside the headline ranking.
An ecosystem is a decision system with a perimeter
Operational decision intelligence sits oddly in urban policy, and the oddness is instructive. Districts are approved as legislation, financed as tax expenditure, built as real estate and communicated as ecosystems, because those are the forms in which public instruments pass, fund, break ground and announce. None of those forms holds a loop. Yet what a district does every week is decide: who is admitted, which metre is allocated, which exemption continues, which tenant graduates. That is the same class of decision a planning engine makes inside an ERP — recurring, resource-constrained, consequential, unlogged.
This is why the methodology change matters more than the ranking it produced. By scoring dispersion across nine dimensions alongside position and trajectory, the 2026 index has started measuring portfolio coherence rather than peak capability — and a city with technology at 17th and economy at 179th is being told, in the only language a comparative index has, that its instruments are not reinforcing each other. Santiago reaching 5th on the balanced measure while sitting below the global leaders on the headline one is the same lesson from the other direction. Coherence is a management artefact, and it is produced by attribution.
Socradata transforms ERP, WMS and supply-chain data into predictive intelligence and governed operational decision systems — and a governed decision system is one where every recurring decision has a record, an owner, a net number and an expiry. A city's district portfolio qualifies, whether or not anyone has built it that way yet.
Find out what your perimeter is actually producing
Every Wednesday, The Operational AI Dispatch translates one consequential AI signal into an operating model, a KPI set and an action plan for leaders running enterprise operations, ERP, WMS, supply chains and public systems. Published weekly by Socradata.